
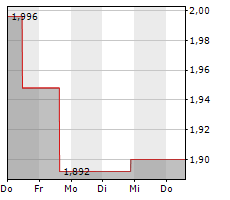

Price €1.95
Market cap €84m
$1.00/€
Net cash (€m) at 30 June 2022 11.6
Shares in issue 43.2m
Free float 86%
Code COX
Primary exchange Euronext
Secondary exchange N/A
Share price performance
% 1m 3m 12m
Abs (6.1) 6.1 (44.3)
Rel (local) 1.4 5.7 (38.5)
52-week high/low €3.5 €1.7
Business description
France-based Nicox develops therapeutics for the treatment of ocular conditions.
Its lead candidate NCX-470 is in Phase III studies for the treatment of glaucoma, and it is advancing NCX-4251 for dry eye disease.
Nicox also receives licence revenue for its FDA-approved drugs Vyzulta and Zerviate.
Next events
Mont Blanc Phase III NCX-470
top-line results
November 2022
Analysts
Pooya Hemami OD MBA CFA +1 646 653 7026
Soo Romanoff +44 (0)20 3077
5700
healthcare@edisongroup.com
Edison profile page
Pharma and biotech
Nicox is a research client of
Edison Investment Research
Limited
Nicox | 22 September 2022 2
Reduced H122 cash burn
Nicox reported H122 financial results, with net revenues in line with trends reported at the company’s Q222 business update in July 2022, when it had reported Q222 net royalty revenue1 of
€0.7m. Gross H122 revenue, which is predominantly derived from Vyzulta sales royalties received from Bausch + Lomb (B+L)2 and is before the consideration of royalties paid to Pfizer, was €2.3m (+13.7% y-o-y).
After offsetting payments to Pfizer (€0.89m, up 23.7% y-o-y), Nicox reported H122 net revenue of €1.43m (+8% y-o-y). As mentioned previously, Vyzulta US prescriptions continue to increase robustly, up 35% y-o-y in Q222 (vs a 21% y-o-y increase in Q221).
We believe that pricing issues in reimbursement are continuing to drive a discrepancy between Nicox’s reported royalties and the Vyzulta prescriptions growth rate, but these should likely flatten out in coming quarters.
Gross H122 R&D costs were €7.8m (vs €10m in H121 and our €7.5m estimate), with the decrease due to the completion in H221 of the Mississippi Phase IIb study for NCX-4251, resulting in lower
clinical trial spending versus the prior-year period (the Mont Blanc and Denali NCX-470 trials were ongoing in both years). G&A costs (inclusive of stock-based compensation) were €3.7m in H122 (vs €3.3m in H121 and our €3.4m estimate).
Altogether, operating costs (including R&D tax credits and excluding depreciation and amortisation) were €11.2m in H122 (vs €12.9m in H121 and our €10.5m estimate).
Nicox incurred a one-time €10.5m impairment charge in H122 relating to its decision to seek a partner to pursue the development of NCX-4251 in the United States and no longer pursue clinicaltrials internally on the product (discussed further below).
The company also reported a non- recurring €1.2m severance payment relating to the change in CEO. Altogether, Nicox reported an H122 operating cash burn rate of €10.3m (vs €10.3m in H121 and our estimate of €9.8m).
Denali study timelines pushed back
One of the key announcements from the H122 results, in our view, is Nicox pushing back its expected timeline for the release of primary efficacy data from the Denali study (the company’s
second Phase III trial for lead candidate NCX-470 for the treatment of glaucoma).
Nicox now expects to report top-line results for Denali after 2024, based on current recruitment rates, whereas in April 2022 it had communicated that Denali study results would not be available by the end of 2023 as it had previously communicated as recently as January 2022.
The company cites lockdowns in China and the COVID-19 pandemic as primary reasons for the study’s delays, as well as ‘longer-term effects on the wider glaucoma clinical trial environment.’ As a reminder, approximately 20% of the c 370 planned patients for the Denali study are to be recruited from sites in China (with the remainder coming from the United States).
The Denali trial is being equally funded by Nicox and Ocumension (Nicox’s commercial partner for the Chinese market) and, like the Mont Blanc study, is evaluating NCX-470 ophthalmic solution (0.1%) versus latanoprost (0.005%).
The Denali and Mont Blanc trials are designed collectively to fulfil the regulatory requirements to support New Drug Application (NDA) filings in the United States and China.
1 Nicox recovered rights to latanoprostene bunod (Vyzulta) from Pfizer in 2009 and it must pay royalties to Pfizer proportionate to the product’s net sales. Nicox receives royalties from Bausch + Lomb on the latter’s net global Vyzulta sales.
Net royalty payments as reported by Nicox consist of its revenue from collaborations including B+L less royalty payments paid to Pfizer. After giving effect to these payments, the net royalty Nicox receives on net Vyzulta sales is between 6% and 12% of net product sales.
We model the payments to Pfizer as part of Nicox’s cost of sales.
2 Nicox also obtains recurring royalty revenue from net Zerviate (cetirizine ophthalmic) sales from US partner Eyevance/Santen, but it does not break down this amount and we estimate that a large majority of its recorded gross royalty revenue is derived from net Vyzulta sales from partner B+L.
Nicox | 22 September 2022 3
The contrast between recruitment patterns in Denali and Mont Blanc trials is noteworthy, given that in June 2022 Nicox pushed forward its expected timeline for the reporting of primary efficacy data for Mont Blanc to November 2022 (from Q123 previously).
The two study designs are very similar (and both have a planned enrolment of c 670 patients) with the primary difference that Denali has a more substantial contingent of clinical trial sites in China, which we believe was designed to satisfy Chinese regulators.
The Denali study also includes a long-term (12-month) safety extension.
In our view, the Denali study is the limiting factor affecting the timing of the potential filing of an NDA for NCX-470 (assuming positive clinical study data from Mont Blanc).
However, with the delays (>12 months) to the projected reporting of Denali data compared to guidance from earlier in 2022, and with further delays beyond 2025 not ruled out, one may speculate that the company may wish to consider pursuing a new US-focused confirmatory Phase III study to accelerate the generation of data to satisfy US NDA requirements.
Given the company’s updated Denali guidance, we are pushing back our timing estimate for the potential NCX-470 launch in the United States to 2027 (from H226 previously).
As a reminder, before the first reported Denali delay in April 2022, we had anticipated that NCX-470 could have been launched in H225 in the United States, and had calculated an rNPV for NCX-470 across all geographies of €217m (compared to our revised NCX- 470 rNPV, as discussed below, of €183m). Hence, the Denali delays are affecting the discounted (present-value) of the commercial revenue opportunity for NCX-470, in our view.
Maintaining a robust outlook for NCX-470
We continue to have a very constructive stance on NCX-470 given the positive Dolomites Phase II study data as discussed in our Outlook report, and are encouraged that Mont Blanc top-line data is expected imminently.
In the 433-patient US multicentre 28-day Dolomites trial, the highest tested NCX-470 concentration (0.065%) demonstrated statistical superiority in IOP lowering to the latanoprost arm at day 28, delivering up to 1.4mmHg of additional lowering of IOP at this time point (p<0.025). The Phase III NCX-470 trials are testing a higher 0.1% drug concentration, which may provide further IOP reduction.
Nicox recently announced that 691 patients have been enrolled in Mont Blanc, the last patients in the trial completed their final study visits, and it expects to report top-line data in early November.
We anticipate that positive Mont Blanc top-line study data, demonstrating superior IOP lowering efficacy to latanoprost, would materially de-risk future NCX- 470 development and likely drive a re-rating of the stock. Further, positive Mont Blanc data could provide optionality as it may open the door for NCX-470 out-licensing transactions (eg for North America, Japan or Europe) or other strategic deals or initiatives.
We highlight that in August 2022,
Alcon announced it was purchasing Aerie Pharmaceuticals for $770m in equity value, a 37% premium to Aerie’s last closing price. Aerie’s leading commercial-stage products, and in our view,
likely the primary drivers for the transaction, are its two FDA-approved glaucoma drugs based on its Rho-kinase inhibitor molecule, netarsudil. These are Rocklatan (a combination of netarsudil and latanoprost) and Rhopressa (netarsudil standalone) and are described in more detail in our outlook report.
Aerie had guided for its total glaucoma franchise net product revenue to be $130–140m for FY22.
NCX-4251 DED strategy to focus on partnering
As stated above, Nicox has decided to cease further internal clinical development for NCX-4251 and will seek to partner the product for the US and other ex-China markets (Ocumension holds
rights to the product in China, Macau, Hong Kong and Taiwan).
As discussed in our Outlook report, NCX-4251, a proprietary ophthalmic suspension of fluticasone propionate nanocrystals, was previously investigated for acute blepharitis, and repositioned for development in DED after a post- hoc analysis of the Mississippi Phase IIb trial showed an improvement in dry eye symptoms and subsequent positive discussions with the FDA in Q122.
This decision should reduce the company’s future capital needs, as we had previously modelled that Nicox would spend c €28m in NCX-4251 related R&D costs between 2023 and year-end 2026. Nonetheless, seeking a US partner at this stage (Phase II) likely limits the potential upside of commercial NCX-4251 revenue and explains the company’s asset impairment charge, and leads to a reduction in our NCX-4251 rNPV (as discussed below).
We have now removed future NCX-4251 R&D costs from our model, and assume that Nicox will obtain a drug development partner for advancing NCX-4251 in DED for the United States,
Europe and other ex-China markets by the end of 2023.
We expect the next Phase II study in DED to begin in 2024, funded by the partner, with a Phase III programme to follow in 2025, and for commercial approval and launch to occur in 2028 (from H227 previously). We assume that Nicox will be entitled to 20% net royalties on commercial sales. Our underlying assumptions for the DED market are unchanged (please see our Outlook report for further details).
Over 30 million people in the United States have DED and over 75% experience short-term exacerbations (which we model at an average of four events per year).
While we consider a sizeable portion of DED patients will not seek medical care for every acute DED episode, we estimate the addressable market to be c 24m potential acute DED episodes per year in the United States. Assuming a gross price at launch of $320 per bottle or treatment course (a c 10% discount to Eysuvis), we model peak US sales of c $420m in the US market in 2032, resulting in c $84m in net NCX-4251 US royalties to Nicox in that year.
Financials
Nicox reported cash and equivalents of €31.6m and non-current financial assets of €0.16m at 30 June, offset by outstanding debt of €20.2m, excluding €1.3m in lease liabilities. We calculate H122
net cash of €11.6m and, as stated above, the H122 operating cash burn was €10.3m.
The company continues to expect that its funds on hand should be sufficient to maintain operations into Q423, based on the development of NCX-470 alone.
Following the company’s results and the change in the NCX-4251 development strategy, we have reduced our R&D forecasts for FY23 and beyond, to reflect the removal of NCX-4251 R&D
spending from our forecasts.
We have also reduced our FY24 G&A cost estimate by €6.6m as we no longer expect significant NCX-470 related marketing expenditures by Nicox in that year (since we have pushed out our NCX-470 launch timing to 2027).
We have also updated our forex assumptions to €/$ parity, and have not revised our local-currency assumptions for Vyzulta and Zerviate royalties, resulting in a mild increase in our euro-denominated revenue forecasts.
We now assume an FY22 operating cash burn rate of €20.0m, up from €18.8m previously, largely reflecting the higher than expected operating expenditure rate in H122 versus our prior estimates.
The changes described above lead to reductions in our operating cash burn estimates for subsequent years. We now expect net operating cash burn rates for FY23e and FY24e, of €16.7m
and €21.7m, respectively, versus our prior estimates of €19.7m and €33.7m, respectively.
Given our new forecasts, we now expect the company will require €85m in added funding before the anticipated launch of NCX-470 (which we now expect in 2027), down from €104m previously.
Our projections do not include any potential proceeds from the exercise of options or warrants, which if exercised would lower our funding forecasts accordingly.
Valuation
Our Nicox valuation applies a risk-adjusted NPV model with a 12.5% cost of capital. We have rolled forward our estimates and adjusted our forex assumptions to €/$ parity (vs $1.05/€ previously).
Nicox | 22 September 2022 5
Compared to our prior valuation, our rNPV for NCX-470 in the US market has decreased (from €146.0m to €132.0m) due to pushing back our expectation for launch into 2027 (from H226previously) given the added delay in the Denali trial.
We have also reduced the rNPV of the NCX- 4251 programme to €37.5m (from €95.1m previously), to consider a NCX-4251 partnership/out- licensing arrangement compared to our prior assumption that the company would have commercialised the product internally and would have retained a higher share of the product’s commercial sales and operating income.
Exhibit 1: Nicox rNPV assumptions
Product contribution Indication Stage NPV
(€m)
Probability
of success
rNPV
(€m)
rNPV/
basic
share (€)
Launch
year
Peak
sales
(€m)**
NCX-470 (net of R&D and SG&A costs) in
US market
Glaucoma Phase III ongoing 273.9 50% 132.0 3.05 2027 386
NCX-470 (net of R&D and SG&A costs) in
Europe and unpartnered regions
Glaucoma Phase III 140.5 35% 47.4 1.10 2028 195
NCX-470 license fees from Ocumension
(China and other)
Glaucoma Phase III ongoing 8.1 50% 3.8 0.09 2027 3.6*
NCX-4251 (net of R&D and SG&A costs)
sales and license fees/royalties
Dry eye disease Phase IIb 150.6 25% 37.5 0.87 2028 84*
Vyzulta royalties from Bausch + Lomb Glaucoma Commercial 39.8 100% 39.8 0.92 2017 11.1*
Zerviate royalties from Eyevance and others Allergic conjunctivitis Commercial 26.8 100% 26.8 0.62 2020 6.7*
Corporate costs (63.3) 100% (63.3) (1.46)
Total 576.4 224.0 5.18
Net cash (H122) excluding lease liabilities 11.6 11.6 0.27
Total equity value 588.0 235.6 5.45
Basic shares outstanding (000) 43,223
Outstanding options and warrants (000) 6,142
FD shares outstanding (000) 49,365
Source: Edison Investment Research. Note: *Reflects net licence income and royalties received by Nicox and not commercial sales by licensee. **Peak projected sales shown for year 2032 except for Vyzulta where peak anticipated royalties are shown for year 2030.
We now obtain an rNPV valuation for Nicox of €224.0m (versus €297.8m previously). After updating for H122e net cash of €11.6m, we obtain an equity value of €235.6m, or €5.45 per basic share
(down from €7.23 previously). After considering the potential dilutive effect of options and warrants and their effects on net cash, our fully diluted valuation would be €5.17 (down from €6.75
previously) per fully diluted share.
Nicox | 22 September 2022 6
Exhibit 2: Financial summary
€(000) 2018 2019 2020 2021 2022e 2023e 2024e
Year end 31 December IFRS IFRS IFRS IFRS IFRS IFRS IFRS
PROFIT & LOSS
Revenue 4,717 8,260 14,423 8,583 5,193 7,298 9,704
Cost of Sales (690) (1,405) (1,516) (1,350) (1,592) (1,750) (2,161)
Gross Profit 4,027 6,855 12,907 7,233 3,601 5,548 7,543
General & Administrative (9,506) (7,666) (6,677) (7,000) (7,755) (8,112) (11,380)
Net Research & Development (15,491) (16,883) (11,991) (17,194) (14,263) (12,336) (14,136)
Amortisation of intangible assets 0 (659) (1,252) (1,205) (423) (798) (778)
Operating profit before exceptionals (20,970) (18,353) (7,013) (18,166) (18,840) (15,698) (18,751)
EBITDA (20,718) (17,230) (5,270) (16,505) (18,029) (14,593) (17,705)
Depreciation & other (252) (464) (491) (456) (388) (307) (268)
Operating Profit (before amort. and except.) (20,970) (17,694) (5,761) (16,961) (18,417) (14,900) (17,973)
Exceptionals including asset impairment 302 (6,115) (6,621) (30,658) (11,631) 0 0
Other 0 0 0 (1,159) 0 0 0
Operating Profit (20,668) (23,809) (12,382) (48,778) (30,048) (14,900) (17,973)
Net Interest 2,390 1,690 (4,436) 1,419 2,057 (1,446) (3,535)
Profit Before Tax (norm) (18,580) (16,004) (10,197) (15,542) (16,360) (16,346) (21,508)
Profit Before Tax (FRS 3) (18,278) (22,778) (18,070) (48,564) (28,414) (17,144) (22,286)
Tax (113) 3,856 (28) 3,644 1,679 0 0
Profit After Tax and minority interests (norm) (18,693) (12,148) (10,225) (13,057) (14,681) (16,346) (21,508)
Profit After Tax and minority interests (FRS 3) (18,391) (18,922) (18,098) (44,920) (26,735) (17,144) (22,286)
Average Basic Number of Shares Outstanding (m) 29.6 30.3 33.7 37.5 43.4 44.0 44.6
EPS – normalised (€) (0.63) (0.40) (0.30) (0.35) (0.34) (0.37) (0.48)
EPS – normalised and fully diluted (€) (0.63) (0.40) (0.30) (0.35) (0.34) (0.37) (0.48)
EPS – (IFRS) (€) (0.62) (0.62) (0.54) (1.20) (0.62) (0.39) (0.50)
Dividend per share (€) 0.0 0.0 0.0 0.0 0.0 0.0 0.0
BALANCE SHEET
Fixed Assets 112,498 110,660 89,745 66,871 61,043 60,121 59,317
Intangible Assets 71,397 72,120 64,848 39,974 32,127 31,329 30,550
Tangible Assets 25,628 27,517 24,829 26,660 28,759 28,634 28,608
Investments in long-term financial assets 15,473 11,023 68 237 158 158 158
Current Assets 26,092 32,146 52,521 47,738 27,437 36,973 41,176
Short-term investments 0 0 0 0 0 0 0
Cash 22,059 28,102 47,195 41,970 21,988 31,059 35,133
Other 4,033 4,044 5,326 5,768 5,448 5,914 6,043
Current Liabilities (8,069) (9,828) (15,404) (8,000) (7,981) (6,677) (5,280)
Creditors (8,069) (7,751) (10,115) (8,000) (7,981) (6,677) (5,280)
Short term borrowings 0 (2,077) (5,289) 0 0 0 0
Long Term Liabilities (16,868) (23,681) (26,027) (31,057) (28,846) (54,846) (80,846)
Long term borrowings 0 (9,045) (12,687) (20,520) (20,196) (46,196) (72,196)
Other long term liabilities (16,868) (14,636) (13,340) (10,537) (8,650) (8,650) (8,650)
Net Assets 113,653 109,297 100,835 75,552 51,653 35,571 14,367
CASH FLOW
Operating Cash Flow (21,533) (17,741) (956) (19,900) (22,036) (15,301) (18,148)
Net interest and financing income (expense) 2,390 1,690 (4,436) 1,419 2,057 (1,446) (3,535)
Tax 0 0 0 0 0 0 0
Net Operating Cash Flow (19,143) (16,051) (5,392) (18,481) (19,979) (16,747) (21,683)
Capex (268) (95) (20) (8) (82) (182) (243)
Acquisitions/disposals 0 0 0 0 37 0 0
Financing 0 11,290 13,321 13,804 186 0 0
Dividends 0 0 0 0 0 0 0
Net Cash Flow (19,411) (4,856) 7,909 (4,685) (19,838) (16,929) (21,926)
Opening net debt/(cash) 0 (37,532) (28,003) (29,287) (21,687) (1,950) 14,979
HP finance leases initiated 0 0 0 0 0 0 0
Other 56,943 (4,673) (6,625) (2,915) 101 0 0
Closing net debt/(cash) (37,532) (28,003) (29,287) (21,687) (1,950) 14,979 36,905
Lease debt N/A 1,527 1,099 986 1,297 1,297 1,297
Closing net debt/(cash) inclusive of IFRS 16 lease debt (37,532) (26,476) (28,188) (20,701) (653) 16,276 38,202
Source: Company reports, Edison Investment Research
Nicox | 22 September 2022 7
General disclaimer and copyright
This report has been commissioned by Nicox and prepared and issued by Edison, in consideration of a fee payable by Nicox. Edison Investment Research standard fees are £60,000 pa for the production and broad dissemination of a detailed note (Outlook) following by regular (typically quarterly) update notes. Fees are paid upfront in cash without recourse. Edison may seek additional fees for the provision of roadshows and related IR services for the client but does not get remunerated for any investment banking services. We never take payment in stock, options or warrants for any of our services.
Accuracy of content: All information used in the publication of this report has been compiled from publicly available sources that are believed to be reliable, however we do not guarantee the accuracy or completeness of this report and have not sought for this information to be independently verified. Opinions contained in this report represent those of the research department of Edison at the time of publication.
Forward-looking information or statements in this report contain information that is based on assumptions, forecasts of future results, estimates of amounts not yet determinable, and therefore involve known and unknown risks, uncertainties and other factors which may cause the actual results, performance or achievements of their subject matter to be materially different from current expectations.
Exclusion of Liability: To the fullest extent allowed by law, Edison shall not be liable for any direct, indirect or consequential losses, loss of profits, damages, costs or expenses incurred or suffered by you arising out or in connection with the access to, use of or reliance on any information contained on this note.
No personalised advice: The information that we provide should not be construed in any manner whatsoever as, personalised advice. Also, the information provided by us should not be construed by any subscriber or
prospective subscriber as Edison’s solicitation to effect, or attempt to effect, any transaction in a security. The securities described in the report may not be eligible for sale in all jurisdictions or to certain categories of investors.
Investment in securities mentioned: Edison has a restrictive policy relating to personal dealing and conflicts of interest. Edison Group does not conduct any investment business and, accordingly, does not itself hold any positions in the securities mentioned in this report. However, the respective directors, officers, employees and contractors of Edison may have a position in any or related securities mentioned in this report, subject to Edison’s policies on personal dealing and conflicts of interest.
Copyright: Copyright 2022 Edison Investment Research Limited (Edison).
Australia
Edison Investment Research Pty Ltd (Edison AU) is the Australian subsidiary of Edison. Edison AU is a Corporate Authorised Representative (1252501) of Crown Wealth Group Pty Ltd who holds an Australian Financial Services Licence (Number: 494274). This research is issued in Australia by Edison AU and any access to it, is intended only for “wholesale clients” within the meaning of the Corporations Act 2001 of Australia.
Any advice given by Edison AU is general advice only and does not take into account your personal circumstances, needs or objectives. You should, before acting on this advice, consider the appropriateness of the advice, having regard to your objectives, financial situation and needs. If our advice relates to the acquisition, or possible acquisition, of a particular financial product you should read any relevant Product Disclosure Statement or like instrument.
New Zealand
The research in this document is intended for New Zealand resident professional financial advisers or brokers (for use in their roles as financial advisers or brokers) and habitual investors who are “wholesale clients” for the purpose of the Financial Advisers Act 2008 (FAA) (as described in sections 5(c) (1)(a), (b) and (c) of the FAA). This is not a solicitation or inducement to buy, sell, subscribe, or underwrite any securities mentioned or in the topic of this document. For the purpose of the FAA, the content of this report is of a general nature, is intended as a source of general information only and is not intended to constitute a recommendation or opinion in relation to acquiring or disposing (including refraining from acquiring or disposing) of securities. The distribution of this document is not a “personalised service” and, to the extent that it contains any financial advice, is intended only as a “class service” provided by Edison within the meaning of the FAA (i.e. without taking into account the particular financial situation or goals of any person). As such, it should not be relied upon in making an investment decision.
United Kingdom
This document is prepared and provided by Edison for information purposes only and should not be construed as an offer or solicitation for investment in any securities mentioned or in the topic of this document. A marketing communication under FCA Rules, this document has not been prepared in accordance with the legal requirements designed to promote the independence of investment research and is not subject to any prohibition on dealing ahead of the dissemination of investment research.
This Communication is being distributed in the United Kingdom and is directed only at (i) persons having professional experience in matters relating to investments, i.e. investment professionals within the meaning of Article 19(5) of the Financial Services and Markets Act 2000 (Financial Promotion) Order 2005, as amended (the “FPO”) (ii) high net-worth companies, unincorporated associations or other bodies within the meaning of Article 49 of the FPO and (iii) persons to whom it is otherwise lawful to distribute it. The investment or investment activity to which this document relates is available only to such persons. It is not intended that this document be distributed or passed on, directly or indirectly, to any other class of persons and in any event and under no circumstances should persons of any other description rely on or act upon the contents of this document.
This Communication is being supplied to you solely for your information and may not be reproduced by, further distributed to or published in whole or in part by, any other person. United States
Edison relies upon the “publishers’ exclusion” from the definition of investment adviser under Section 202(a)(11) of the Investment Advisers Act of 1940 and corresponding state securities laws.
This report is a bona fide publication of general and regular circulation offering impersonal investment-related advice, not tailored to a specific investment portfolio or the needs of current and/or prospective subscribers. As such, Edison does not offer or provide personal advice and the research provided is for informational purposes only. No mention of a particular security in this report constitutes a recommendation to buy, sell or hold that or any security, or that any particular security, portfolio of securities, transaction or investment strategy is suitable for any specific person.
care of the redaction